
By John DiConsiglio
Pop economics quiz: You are a high school senior. After graduation, you’re presented with two options: going to college or accepting a $30,000-a-year job managing the local video game store.
What is the “opportunity cost” of choosing college?
You may need a brief Econ 101 refresher: An opportunity cost is the value of the next-best alternative—essentially, the benefits you would have derived if you made the other choice. By pursuing college over a job, your opportunity cost—the option you are forgoing—is seemingly the $30,000 salary. In some economics class, that answer would earn you an A.
But don’t reserve your spot on the Dean’s List just yet. Did you factor in the financial toll of college, from books and board to tuition and loans? How did you calculate the value of education over employment? The video game gig has its perks too, from a steady paycheck to all the “Call of Duty” you can play. But would a degree have led to a higher-paying and, perhaps, a more fulfilling career?
Basic economic concepts often seem as simple as supply-and-demand, but that’s the riddle of economics—a discipline that puts the science in poli-sci. Dig a little deeper and each equation can reveal variables, indicators and exceptions that would confuse a Nobel laureate. A cursory understanding of economics may be fine for balancing your checkbook. But too often students, teachers and even world-class economists stumble over basic concepts.
Connor Delaney, a senior economics major, may have hit on a method for making econ more accessible—and his idea has resulted in a Luther Rice Undergraduate Research Fellowship, which provides funding support to Columbian College undergraduates engaged in faculty-mentored research projects.
With Assistant Professor of Economics Irene Foster as his mentor, Delaney theorized that economic concepts themselves aren’t the sticking point; it’s the way they are taught. As part of his Luther Rice project, Delaney devised a teaching strategy using easy-to-understand concept maps to unpack the hidden complexity behind fundamental ideas. By testing his method in Foster’s Principles of Microeconomics class, Delaney hopes his approach will help students decipher everything from basic to complex economic ideas. And, Delaney suggested, the implications may reach farther than the economics lecture hall.
“This sounds starry-eyed, but the long-term potential of our work is to change the way we teach almost anything,” he said.
A Perpetual Cycle
As a tutor to students from Foster’s introductory classes, Delaney encountered freshmen who struggled with rudimentary “opportunity cost” concepts, which often hindered their progression to more complex analytical thinking. “Opportunity cost is a fundamental aspect of economic theory, and contributes to almost every higher-level concept in the field,” Delaney said. “Lacking a comprehensive understanding of opportunity cost can affect your understanding of all of economics.”
And, according to Foster, the lack of understanding goes well beyond GW’s classrooms. Georgia State University researchers quizzed 200 top economists from 30 universities. They were asked pop quiz-style questions on basic opportunity cost concepts. Only 20 percent answered correctly. “If educators have incomplete knowledge, they will pass it on to their students,” Foster said. “It’s a perpetual cycle.” Foster herself admits that “since my students get these problems wrong over and over again, I am obviously not teaching it well.”
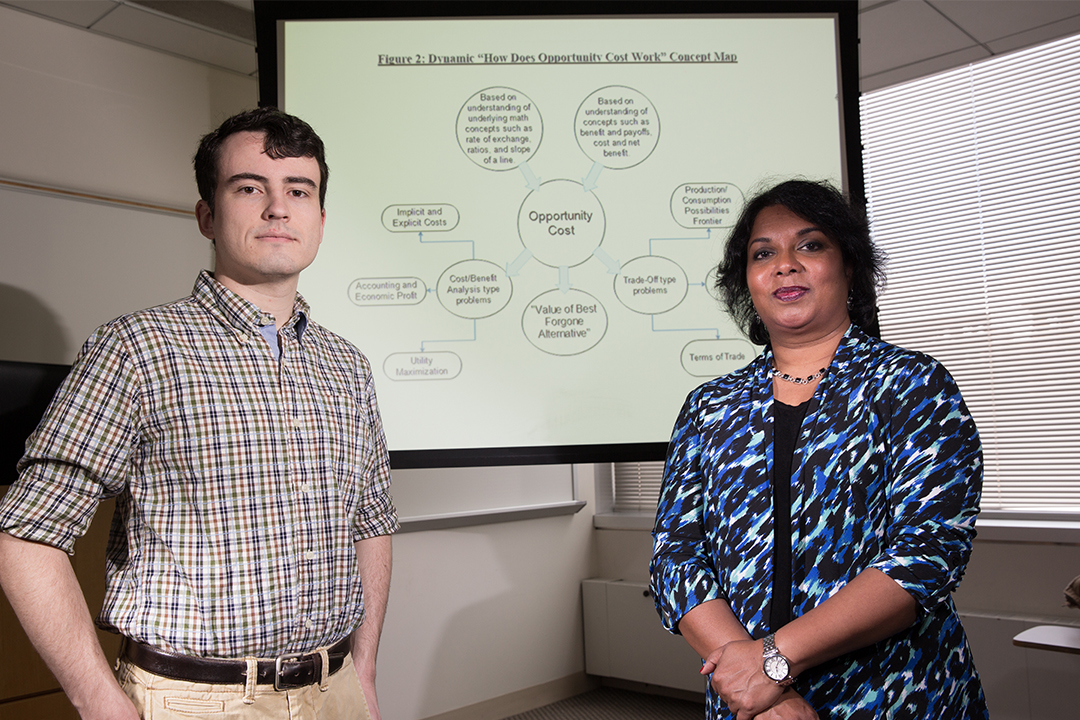
With that in mind, Delaney modified his own slide presentation for struggling students into a teaching strategy involving concept maps—visual tools for representing a single idea along with all of its many related sub-concepts. Picture a series of interlocking circles and boxes that are connected by straight lines. The center box contains the main concept—in this case, opportunity cost. Surrounding that principle node are connected topics and subtopics.

Delaney’s concept map is a visual tool to teach a single idea like opportunity cost and explain its connections to numerous variables.
“This is Research”
Like economic theories themselves, designing a concept map was deceptively complex. For weeks, Delaney and Foster tore through a dozen prototypes, scratching out one design after another. “We sat across from each other at my desk, sheets of paper between us, passing the maps back-and-forth, drawing all over them,” Foster recalled. Some iterations were skillfully constructed “and quite conceptually brilliant,” Foster noted, “but they weren’t practically useful in solving problems.” Each crumpled piece of paper tossed into the trash brought more frustration and disappointment. “We went back to the drawing board again and again,” Foster said. “I told [Delaney]: ‘This is research; this is how it goes.’”
Finally, they settled on two maps—a “static” map that defined the scope of the concept, and a “dynamic map” that not only explained opportunity cost but also worked as a guide to solving problems. They pilot tested their design on Foster’s 700-student microeconomics class. At December discussion sections, students were asked to solve two moderately difficult opportunity cost questions. One was a question that students had seen many times during the semester, while the other was relatively unfamiliar. They were given study-aids that, according to Delaney, “straight-up told them how to answer the question.” Half received blandly-written text explanations, a standard economics teaching tool. The other half were handed the concept maps.
The results of the pilot test were initially disheartening. There appeared to be no significant difference in the concept map scores versus the text format. But on closer inspection, Delaney noticed that the map group scored higher on one of the quiz questions—the one that dealt with unfamiliar material. While the statistics weren’t conclusive, they suggest that concept maps may help students understand new ideas but are less effective in teaching familiar material.
The next step, Foster said, is to expand their work into a semester-long experiment, using the maps as both a teaching tool for instructors to prepare their curriculum and present it to their classes, and as a learning tool for students to build their understanding of a concept.
Numerous studies have shown the effectiveness of concept maps in teaching STEM topics, but they have never been widely tested in economics. Delaney’s preliminary map results are far from conclusive; still, his Luther Rice project earned him an invitation to present his research at the American Economic Association’s annual conference in Boston this January—a rarity for an undergraduate. “It’s a special honor,” Foster said. “There are professors who can’t get their papers accepted [at the conference]. Connor has hit on something new and interesting.”
Indeed, the teaching maps not only provide a much-needed framework for relaying economic concepts, but they could herald a shift in education strategies. “This research actually helps improve my teaching,” Foster said. “Next year, when my class covers opportunity cost, I know I am going to do a much better job thanks to Connor’s work.”